# Auto-layout a diagram
Use a layout algorithm when node positions come from the graph rather than from hand-authored coordinates. This page mounts the same pipeline in JavaScript, Angular, Qwik, React, and Vue, runs a named layout, and fits the result into the canvas.
## When to use it
Use auto-layout for pipelines, trees, networks, and other graphs whose geometry should follow their nodes and edges. The model remains the source of truth; the engine calculates positions and writes them back to the live diagram.
The layout entry point is [`DiagramEngine`](https://atloria.dev/p/grafloria-h7YM7amryF/developer/grafloria-engine-engine#diagramengine). Use a named algorithm when you want a predictable choice, or omit the name to let `auto` classify the graph. The registered names include `auto`, `elk`, `dagre`, `layered`, `tree`, `grid`, `circular`, `radial`, `force`, `spectral`, and `community`.
## Prerequisites
Install the package for your binding and its rendering dependencies. The examples below use the current published versions: `@grafloria/engine` 0.3.18, `@grafloria/renderer` 0.4.19, `@grafloria/angular` 0.13.7, and `@grafloria/qwik`, `@grafloria/react`, or `@grafloria/vue` 0.10.6.
```bash
npm install @grafloria/engine @grafloria/renderer
```
Install the binding package as well when you use Angular, Qwik, React, or Vue.
## 1. Define a graph and run a layout
Give every node a size and an initial position. Starting the nodes at `(0, 0)` makes the result visible: the selected algorithm must separate them. Pass the graph to the binding, obtain the [`DiagramInstance`](https://atloria.dev/p/grafloria-h7YM7amryF/developer/grafloria-renderer-instance-diagraminstance#diagraminstance) when the canvas is ready, then call `getEngine().layout()` and `fitView()`.
:::code-group
```js title="JavaScript"
import { render } from '@grafloria/element';
const nodes = [
{ id: 'ingest', position: { x: 0, y: 0 }, size: { width: 130, height: 52 }, label: 'Ingest' },
{ id: 'parse', position: { x: 0, y: 0 }, size: { width: 130, height: 52 }, label: 'Parse' },
{ id: 'validate', position: { x: 0, y: 0 }, size: { width: 130, height: 52 }, label: 'Validate' },
{ id: 'publish', position: { x: 0, y: 0 }, size: { width: 130, height: 52 }, label: 'Publish' },
];
const edges = [
{ id: 'e1', source: 'ingest', target: 'parse' },
{ id: 'e2', source: 'parse', target: 'validate' },
{ id: 'e3', source: 'validate', target: 'publish' },
];
const container = document.getElementById('diagram');
if (!container) throw new Error('Missing #diagram');
container.style.height = '400px';
const instance = render({ nodes, edges }, container);
const engine = instance.getEngine();
async function arrange() {
await engine.layout('dagre', { nodeSpacing: 40, rankSpacing: 90 });
instance.renderNow();
instance.fitView(50);
}
arrange();
```
```ts title="Angular"
import { AfterViewInit, Component, viewChild } from '@angular/core';
import { DiagramCanvasComponent } from '@grafloria/angular';
import type { EdgeSpec, NodeSpec } from '@grafloria/renderer';
const nodes: NodeSpec[] = [
{ id: 'ingest', position: { x: 0, y: 0 }, size: { width: 130, height: 52 }, label: 'Ingest' },
{ id: 'parse', position: { x: 0, y: 0 }, size: { width: 130, height: 52 }, label: 'Parse' },
{ id: 'validate', position: { x: 0, y: 0 }, size: { width: 130, height: 52 }, label: 'Validate' },
{ id: 'publish', position: { x: 0, y: 0 }, size: { width: 130, height: 52 }, label: 'Publish' },
];
const edges: EdgeSpec[] = [
{ id: 'e1', source: 'ingest', target: 'parse' },
{ id: 'e2', source: 'parse', target: 'validate' },
{ id: 'e3', source: 'validate', target: 'publish' },
];
@Component({
standalone: true,
imports: [DiagramCanvasComponent],
template: '',
})
export class AutoLayoutComponent implements AfterViewInit {
readonly canvas = viewChild.required(DiagramCanvasComponent);
nodes = nodes;
edges = edges;
async ngAfterViewInit(): Promise {
await this.canvas().applyLayout({ name: 'dagre', options: { nodeSpacing: 40, rankSpacing: 90 } });
this.canvas().fitToContent();
}
}
```
```tsx title="Qwik"
import { component$, $ } from '@builder.io/qwik';
import { GrafloriaFlow, type EdgeSpec, type NodeSpec, type DiagramInstance } from '@grafloria/qwik';
const nodes: NodeSpec[] = [
{ id: 'ingest', position: { x: 0, y: 0 }, size: { width: 130, height: 52 }, label: 'Ingest' },
{ id: 'parse', position: { x: 0, y: 0 }, size: { width: 130, height: 52 }, label: 'Parse' },
{ id: 'validate', position: { x: 0, y: 0 }, size: { width: 130, height: 52 }, label: 'Validate' },
{ id: 'publish', position: { x: 0, y: 0 }, size: { width: 130, height: 52 }, label: 'Publish' },
];
const edges: EdgeSpec[] = [
{ id: 'e1', source: 'ingest', target: 'parse' },
{ id: 'e2', source: 'parse', target: 'validate' },
{ id: 'e3', source: 'validate', target: 'publish' },
];
export default component$(() => (
instance.getEngine().layout('dagre', { nodeSpacing: 40, rankSpacing: 90 }).then(() => {
instance.renderNow();
instance.fitView(50);
}))} />
));
```
```tsx title="React"
import { GrafloriaFlow } from '@grafloria/react';
import type { DiagramInstance, EdgeSpec, NodeSpec } from '@grafloria/react';
const nodes: NodeSpec[] = [
{ id: 'ingest', position: { x: 0, y: 0 }, size: { width: 130, height: 52 }, label: 'Ingest' },
{ id: 'parse', position: { x: 0, y: 0 }, size: { width: 130, height: 52 }, label: 'Parse' },
{ id: 'validate', position: { x: 0, y: 0 }, size: { width: 130, height: 52 }, label: 'Validate' },
{ id: 'publish', position: { x: 0, y: 0 }, size: { width: 130, height: 52 }, label: 'Publish' },
];
const edges: EdgeSpec[] = [
{ id: 'e1', source: 'ingest', target: 'parse' },
{ id: 'e2', source: 'parse', target: 'validate' },
{ id: 'e3', source: 'validate', target: 'publish' },
];
export default function AutoLayout() {
const onInit = async (instance: DiagramInstance): Promise => {
await instance.getEngine().layout('dagre', { nodeSpacing: 40, rankSpacing: 90 });
instance.renderNow();
instance.fitView(50);
};
return
;
}
```
```vue title="Vue"
```
:::





Each version renders the four-node pipeline with 40 units between neighboring nodes and 90 units between ranks. `renderNow()` repaints immediately after the engine changes positions; `fitView(50)` frames the complete graph with padding.
## 2. Let Grafloria choose
Use `auto` when the graph shape matters more than a fixed algorithm. The JavaScript form is an omitted name; the component bindings accept the string value.
```js
async function fitAutomaticLayout(instance) {
await instance.getEngine().layout();
instance.renderNow();
instance.fitView(50);
}
```
An unknown layout name throws an error listing the registered names. Use a registered name when your interface lets the reader choose an algorithm.
## Options that matter
| option | type | default | what it does |
| --- | --- | --- | --- |
| `nodeSpacing` | `number` | algorithm-specific | Sets spacing between neighboring nodes. |
| `rankSpacing` | `number` | algorithm-specific | Sets spacing between ranks. |
| `seed` | `number` | fixed layout seed | Makes a layout with the same graph reproducible. |
| `nested` | `boolean` | enabled when the diagram has groups | Controls nested-container layout; set `false` to opt out. |
The same options object goes to `engine.layout(name, options)`. The engine returns a layout result after it commits positions; the result includes the selected algorithm, seed, node positions, and bounds.
## Pitfall: ports are hidden by default
Ports are hidden until hover. If the layout is part of a persistent editing surface and readers need to see connection points, set `portVisibility: 'always'` when creating the diagram or update the live engine:
```js
function showPorts(instance) {
instance.getEngine().setInteractionConfig({ portVisibility: 'always' });
}
```
## See it running
Open the [auto-layout demo](https://grafloria.com/demos/layout/auto-layout.html) to switch between algorithms on a graph whose nodes begin stacked at the origin. The demo also checks that the layout commits positions, avoids overlaps, and produces different pictures for different engines.
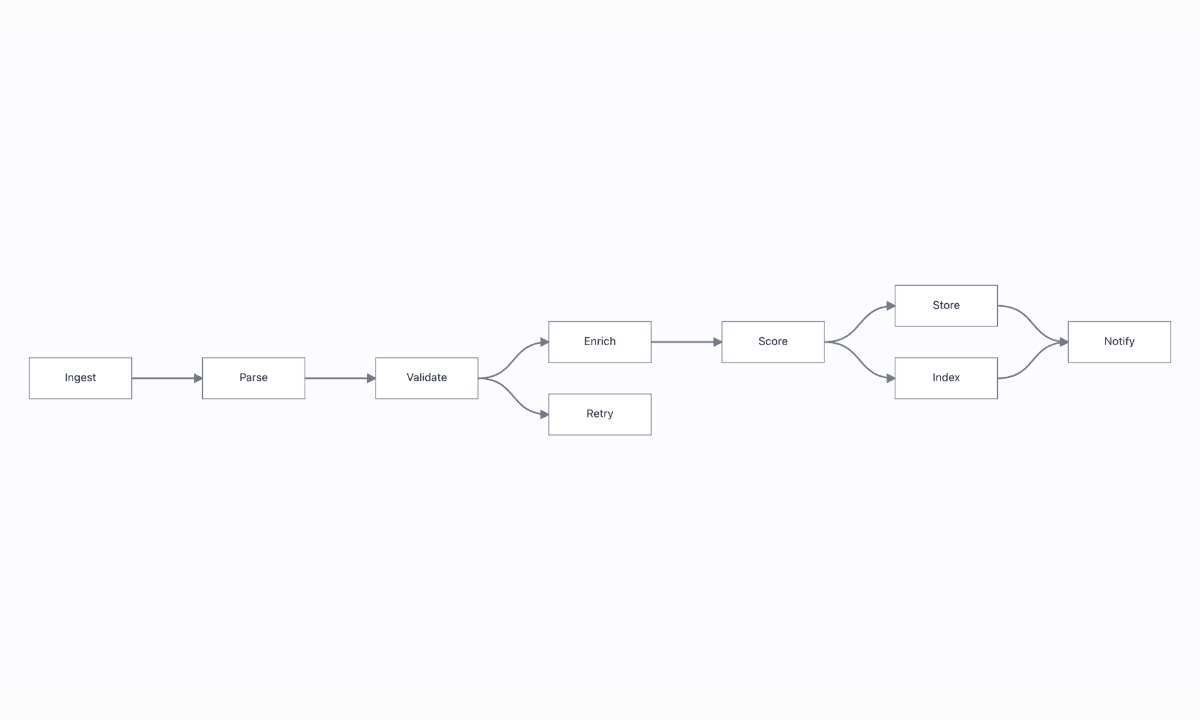
For a graph with disconnected components, see the [layout portfolio demo](https://grafloria.com/demos/layout/layout-portfolio.html). For incremental changes that preserve the user's mental map, see [layout and routing](https://atloria.dev/p/grafloria-h7YM7amryF/developer/layout-and-routing).
## Related
- [How Grafloria works](https://atloria.dev/p/grafloria-h7YM7amryF/developer/how-grafloria-works)
- [Style a diagram](https://atloria.dev/p/grafloria-h7YM7amryF/developer/style-a-diagram)
- [Create custom nodes](https://atloria.dev/p/grafloria-h7YM7amryF/developer/create-custom-nodes)